Network Forensics Basics : How To Check and Analyze Unexpected Network Traffic On Windows or Linux Machine
by
mo
·
So in one previous post, we talked about the importance of using some kind of bandwidth monitoring tool to be able to see bandwidth usage in real time for many reasons… Among those reasons was being able to keep an eye on unexpected bandwidth hoggers which could be malware traffic or unwanted applications, now we will see how to act when an abnormality is observed.
What’s The Typical Abnormal Scenario?
So you are on your machine, doing some activity that does not involve light or heavy bandwidth usage and then you notice unexpected traffic usage reported by the network monitor like below.
Out of curiosity, we would typically want to know what is behind that bandwidth usage, maybe it’s innocent windows updates or it could also be unwanted malware behavior.
Required Tools
Mainly we will need three types of tools, a bandwidth monitor, a packet capture tool and a tool to list open TCP/UDP ports along with the names of the processes using these ports.
Bandwidth Monitor
A bandwidth monitor is our alerting tool that should be previously installed and functioning as a watchdog to keep tabs on the bandwidth utilization in general… Any abnormal activity triggered here should raise an alarm, I have talked about why it’s absolutely necessary to install a bandwidth monitoring tool before in the post Why You Must Have A Live Bandwidth Monitoring Tool.
There are many real time bandwidth monitoring tools for every platform you can use Networx for windows, Netspeed GNOME extension for Linux.
|
|
|
A bandwidth monitoring tool is essential to alert for any unexpected network traffic! |

Packet Capture
Packet capture is of utmost necessity to capture the most meaningful artifact, the traffic itself… of course when a packet capture is mentioned, we are going to use either Wireshark or tcpdump to capture the traffic but for traffic analysis later on, we are going to use Wireshark because of its powerful capture analysis tools.
Listing Open Ports
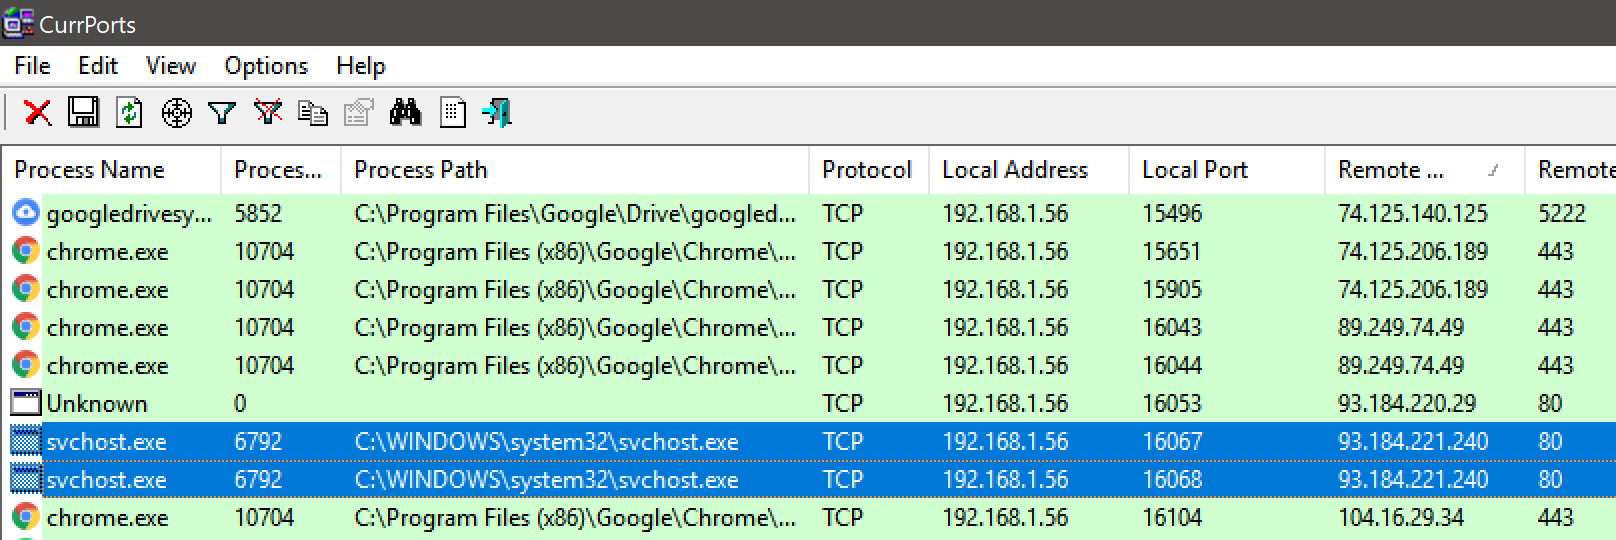
Listing ports being used is crucial in our case, it will assist in finding out which process on our system is using the ports and it will be very helpful to determine the nature of traffic in question… for this purpose we will use netstat (Windows/Linux) or a GUI tool on windows like CurrPorts which is a free, small and very effective tool.
|
|
|
CurrPorts is like glorified netstat with beautiful GUI |
What To Do When Unexpected Traffic Is Observed?
Capture Network Traffic
When you notice unexpected traffic on the bandwidth monitor, the first thing you want to do is to capture that traffic using Wireshark… open up Wireshark and start a capture without filters on the interface being used (wireless or LAN interface) right away, leave Wireshark capturing traffic for as much time as you can… the more traffic captured the more sense it makes, after enough data has been collected, you can stop the capture.
|
|
|
If in doubt which interface is active, Wireshark visualises the traffic on each active interface, otherwise you can use ctrl+left click to select more than one interface, you can also tell Wireshark to list only the physical interfaces and not the virtual ones |
Listing Local & Remote Open Ports
In parallel with capturing the traffic, you definitely want to either use netstat or CurrPorts to list the open ports at the time the unusual traffic is observed…
Using netstat
Netstat can be a lifesaver when there is no other tool like CurrPorts installed, mainly because it comes with Windows and all Linux distributions although the command parameters are a bit different but at the end it does the same purpose.
Netstat On Windows
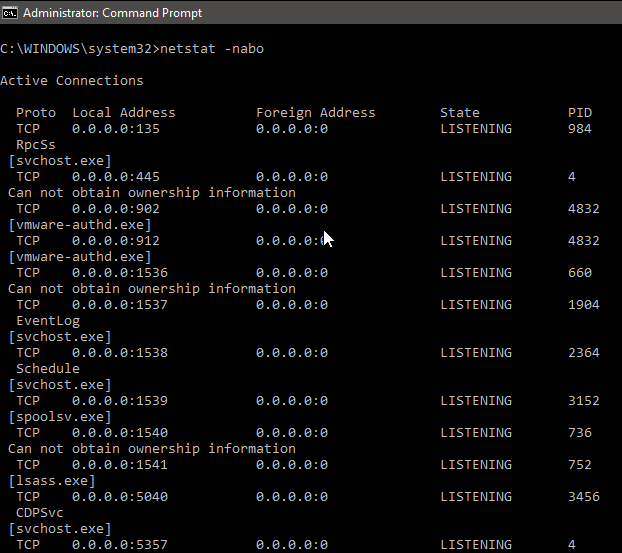
Start a windows cmd shell with administrator privileges which is necessary for using the CLI parameter “b” to show the executable name used for each connection.
In cmd type netstat -nabo, here’s an explanation of each CLI parameter involved:
|
n |
Do not resolve hostnames and port numbers which makes it way faster |
|
a |
show all connections and listening ports |
|
b |
show the executable name |
|
o |
show the process ID |
|
|
|
With the correct parameters, netstat on Windows shows local and remote ports and addresses as well as the PID and the process name associated with each connection |
Netstat On Linux
Netstat on Linux functions exactly like on Windows, the CLI parameters are a bit different, for Linux we will use this : sudo netstat -natup
|
n |
Do not resolve hostnames and port numbers which makes it way faster |
|
a |
Display all sockets (ports in Linux terminology) |
|
t |
Display TCP connections |
|
u |
Display UDP connections |
|
p |
Display PID (process ID) and process name |
|
localuser@localmachine:~$ sudo netstat -tuanp |
|
Netstat on Linux showing us all open connections along with local & remote addresses, ports and the PID/Process name |
Using CurrPorts
CurrPorts is a beautiful and simple tool that lists all the open ports along with the processes using them, one important thing to note though when using it though is to disable the “Auto Refresh” option under Options > Auto Refresh to prevent interesting connections from disappearing after being logged.
What To Do With Collected Packet Captures & netstat / CurrPorts Output
Packet Capture Inspection
Here comes the Wireshark part… The first thing we want to do is to identify the TCP/UDP conversations with most traffic and by traffic we are talking about the amount of data exchanged between peers, of course one of the peers is our local machine and the other peer is yet to be identified…
Finding The Conversations With Most Traffic
Wireshark as a powerful capture analysis tool has a very useful “Conversations” list under Statistics > Conversations, once you open up the Conversations window you will see a list of all conversations in the packet capture organized in 5 tabs: Ethernet, IPv4, IPv6, TCP, UDP. There may be more or less tabs but these are the ones most commonly present depending on the data in the capture file.
|
|
|
Wireshark Conversations Window is a very handy tool and the first place to look in a capture file |
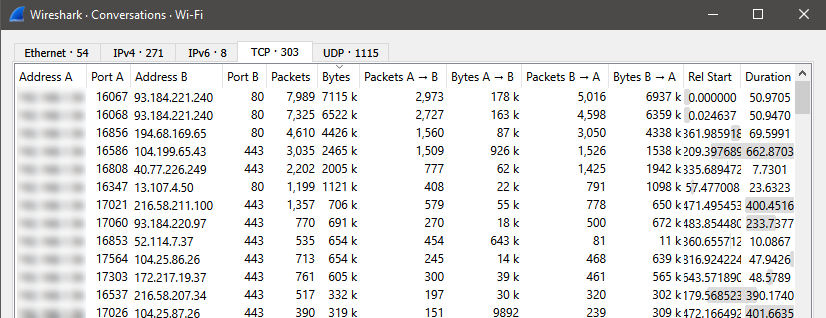
In our case, we will go first to the TCP tab to check the TCP conversations as these are most likely to be of interest.
- Click on the Bytes column to sort the list by total amount of bytes descendingly.
- Now we can see which TCP conversations exchanged most data in the packet capture.
- The IP address under “Address A” column should be our local IP address
- Note the local port under “Port A” column.
- Note the remote IP address and port under “Address B” and “Port B” columns.
Here we see that there are some conversations of interest, two conversations with most traffic are between our local IP at ports 16067,16068 and a remote public IP 93.184.221.240 at port 80.
We can dive into the other conversations as well but for the sake of brevity we are going to check those two only.
Filtering On Interesting Conversations
After finding out which conversations are behind most traffic, it makes sense to take a closer look at those conversations in Wireshark in an attempt to see the packet stream data.
|
|
|
Good for us, there is an easy way to apply a display filter from the Conversations window |
Right click on the conversation with most traffic and then “Apply as Filter > Selected > A ↔ B”.
Go to the main Wireshark window, now a display filter is applied to match only the selected conversation.
|
Please do keep in mind that looking at the data exchanged may or may not make much sense depending on the type of traffic being filtered, the main reason for this is that the traffic may be encrypted or simply not in a human readable format but it’s a first attempt to try to understand the nature of the traffic. |
Following The White Rabbit (aka TCP Stream)
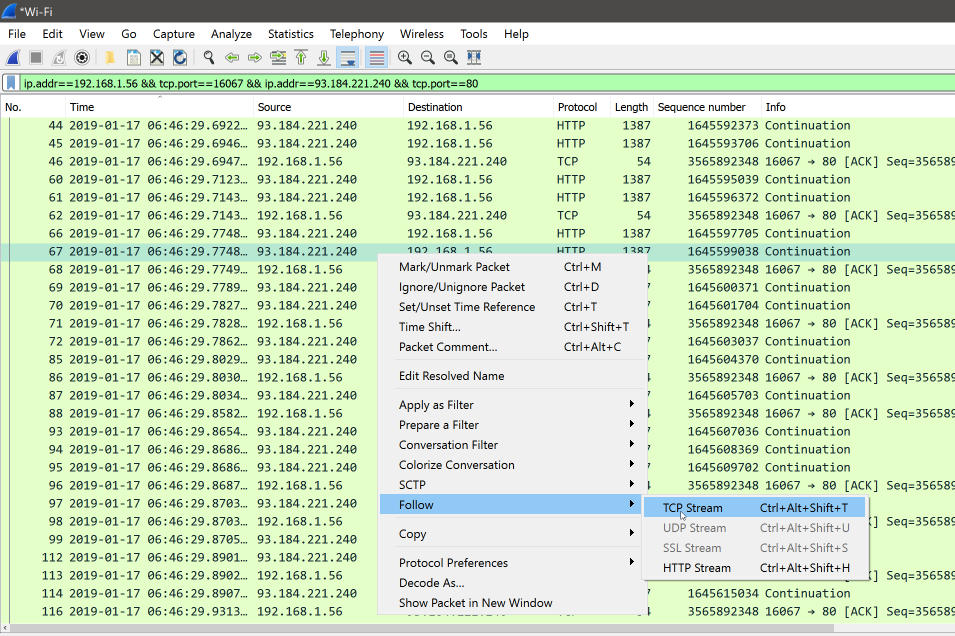
Now that we have filtered out other noise in the capture file, we just want a quick look at the data exchanged so we will tell Wireshark to “Follow the TCP stream”, just right click on any packet in the packet list and go to Follow > TCP Stream
|
|
|
Following the TCP stream is a very quick way to look at the actual data exchanged |
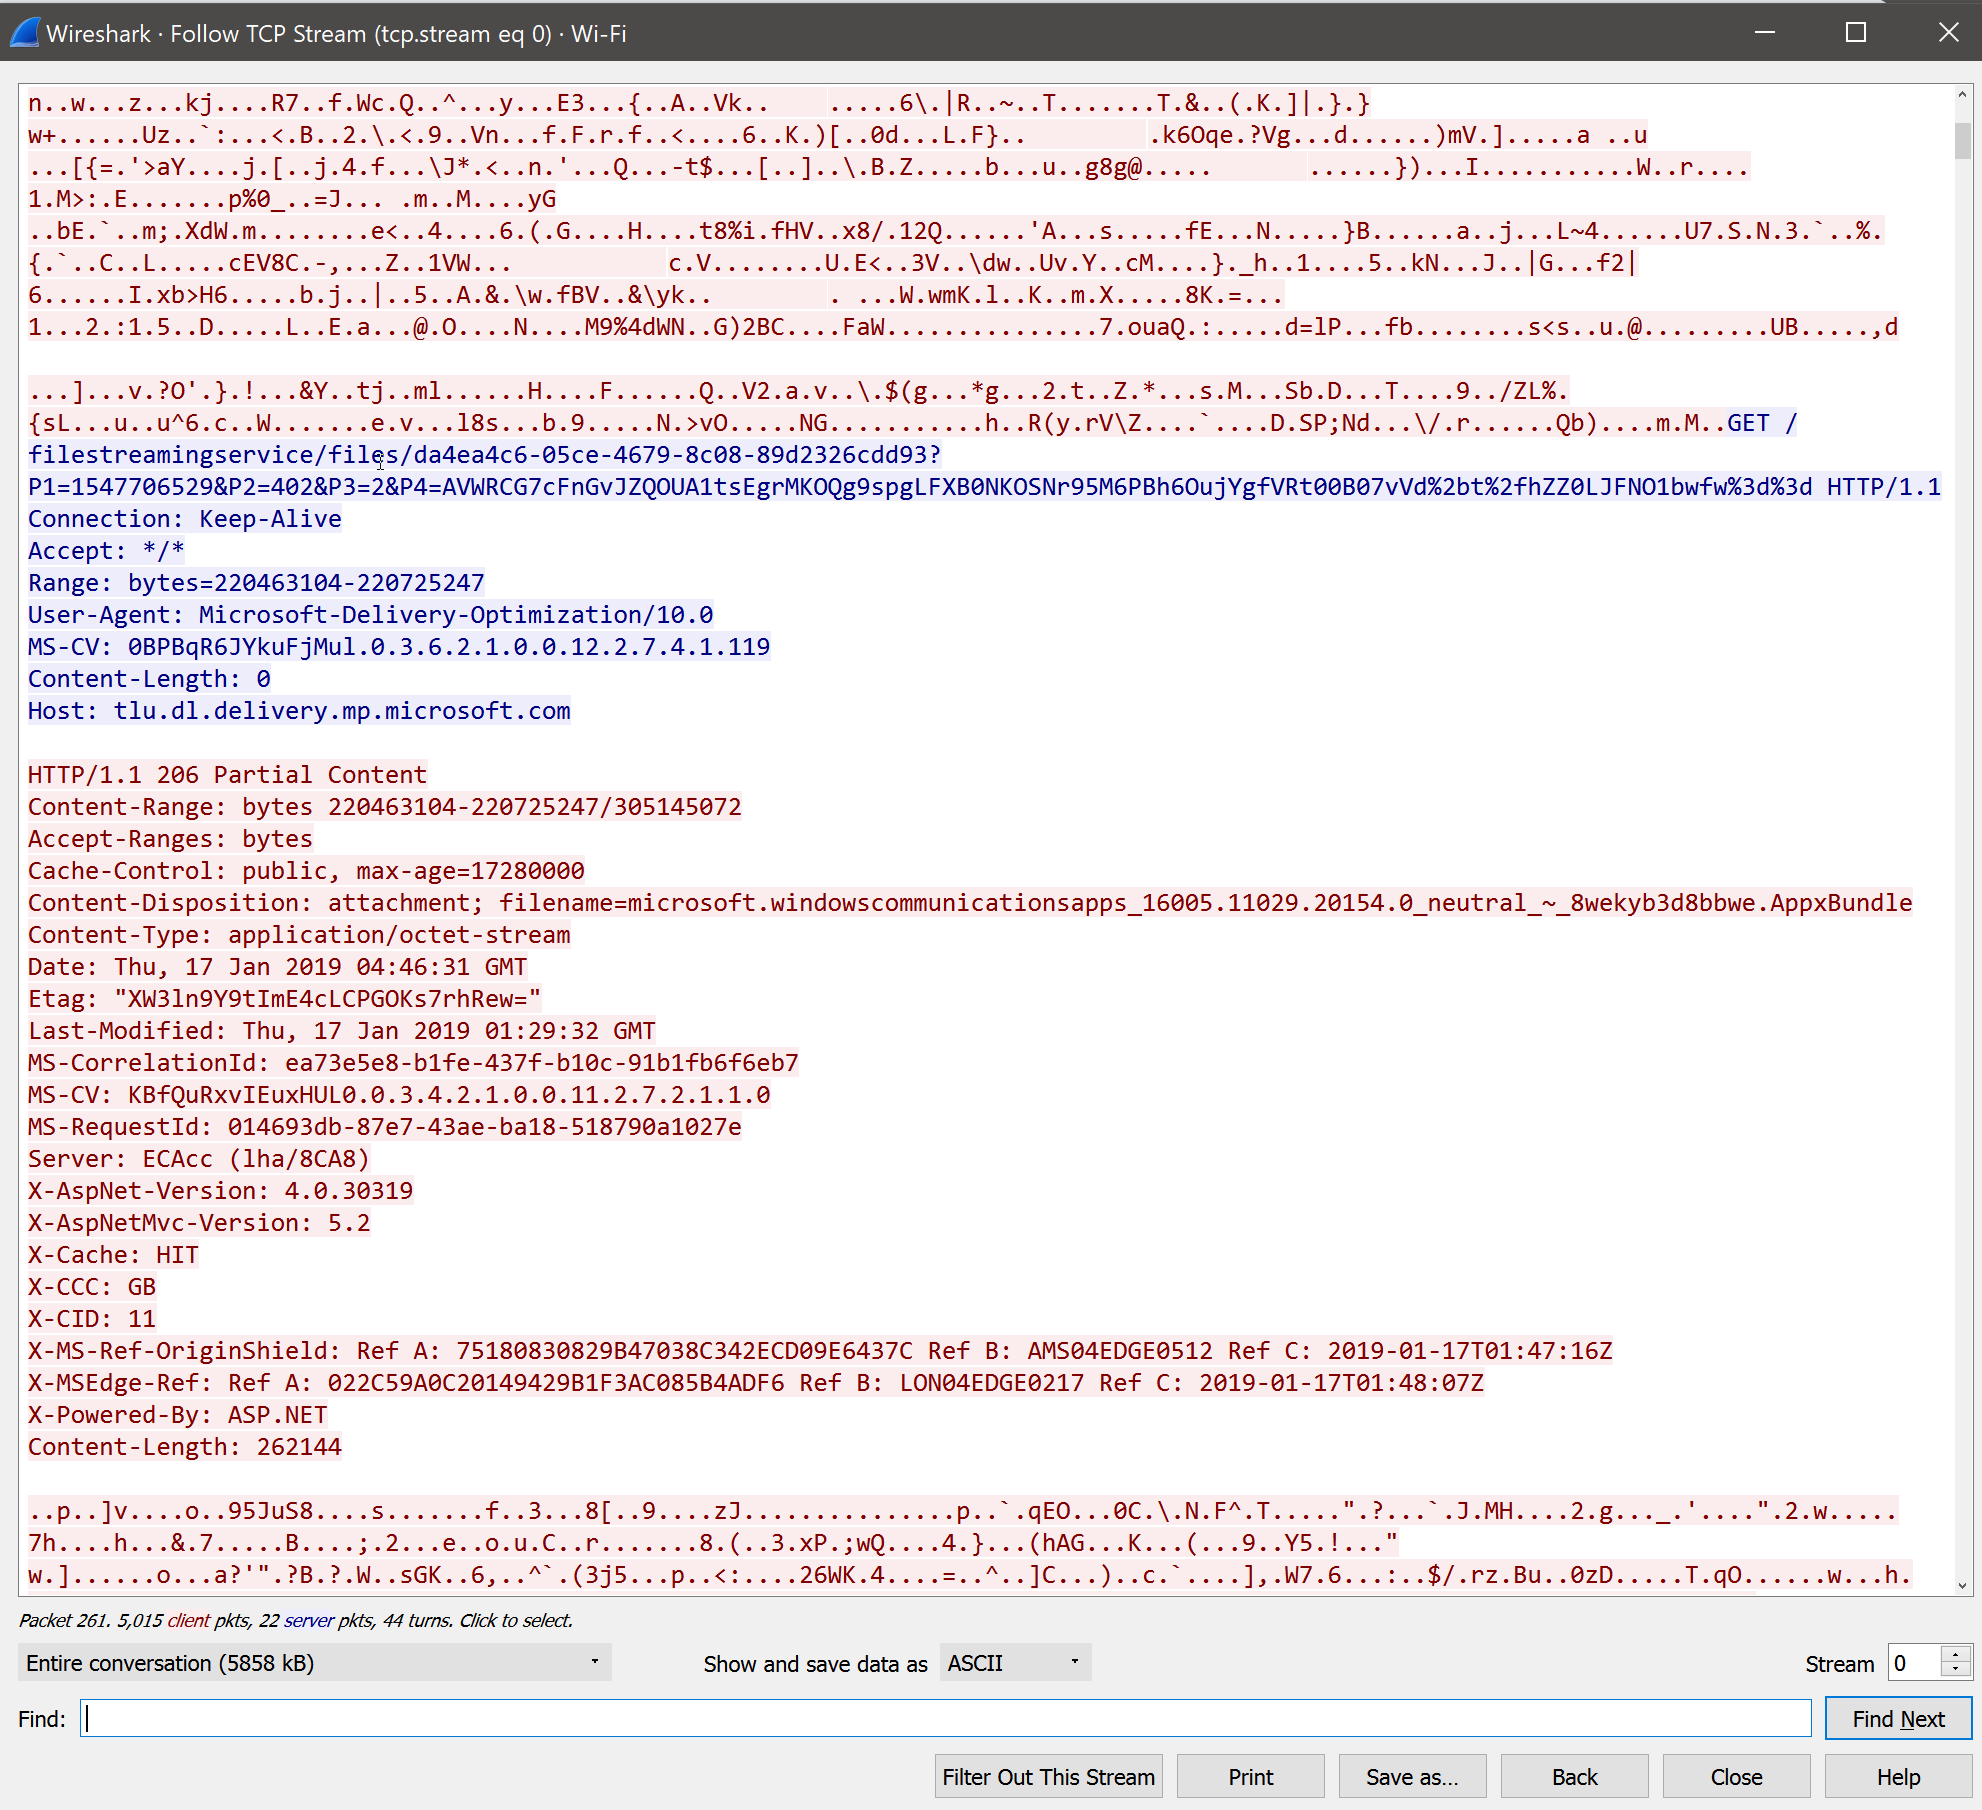
After following the TCP stream, we will get a window with the actual data exchanged in conversation, scroll down through that window to see if any data makes sense.
|
It’s also worth to note that even if the stream is HTTPS and we were lucky enough to capture the TLS handshake, we can also determine the domain or server name from the server certificate or the SNI (Server Name Indication) extension in the CLIENT HELLO message. |
In our case, most of the stream was not human readable but it’s good for us that the traffic was just HTTP traffic so I was able to locate the below ASCII data showing that the other end of the communication was a server named tlu.dl.delivery.mp.microsoft.com
|
|
|
TCP stream data shows clearly the nature of our traffic, the blue text is client request and the red text is server response |
Just google it!
At this point, it wouldn’t hurt to find out what the server name we found in the packet data really is, a quick Google search for the server showed that I am not alone checking this traffic,for example here at Microsoft forums, seems like it’s related to Windows Update detection engine.
|
|
|
A quick Google search (or whatever search engine) can be really helpful |

|
Something important to note is that, the presence of the Host HTTP header pointing to a certain server cannot be trusted to be really pointing to that server, after all this is a Host header that is set by the client and not the domain itself! Any malware can be programmed to specify any Host header to evade detection by IPS devices! We need to do further checks to verify the nature of the connection. |
netstat/CurrPorts Output
At this point, assuming we did not find anything useful in the TCP stream for any reason because of encryption or it being not simply human readable, there is something very useful that we can do right now which is locating the local application that was handling the request.
Finding Out The Application Name
To find out the local application/program that was handling the request on our machine, we are going to check the netstat or CurrPorts output that was taken earlier during the active traffic, of particular interest to us will be the destination IP address and the local source port of the communication.
Destination IP Address
Of course the destination IP address is a strong link between the traffic and the process that was handling the traffic locally but to find out the specific TCP stream, we will also need the source port.
Source Port
The source port of the traffic is an ephemeral port, that is, it’s a local port that is assigned by the OS to the process when the process wants to communicate with another peer.
|
|
|
As per the CurrPorts output, the process svchost.exe located at C:\windows\system32\svchost.exe was the source of the communication |
Thanks to the friendly output of CurrPorts, it was easy to determine the process behind the communication, it is also very important to note the Process Path as any malware can be given the name of a legitimate process, even if the path seems to be correct
|
The only way to truly verify the integrity of the executable is to calculate the MD5 or SHA hash and compare it with hashes for known executables. |
rDNS (Reverse DNS) & IP WHOIS
Another trick is that we can simply try to find out the “owner” of the IP address that we are communicating with, we can do a reverse DNS query, or check the results from any online website that provides WHOIS lookup.
We can also find more information like the geographical location of the IP addresses, some countries are known to be a source of many attacks, that is if the real IP address is not hidden some way or another.
|
|
|
A simple WHOIS lookup shows the owner of the IP and the subnet to be Edgecast. |
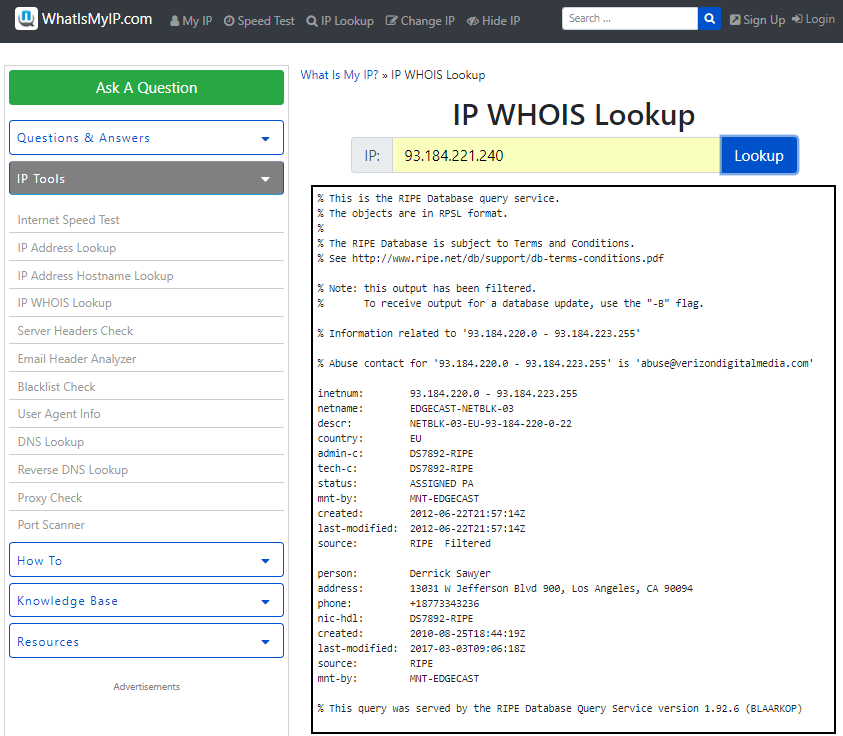
In our case, the owner of the IP is Edgecast, a CDN company owned by Verizon.
Just Try To Open It Up In Your Browser
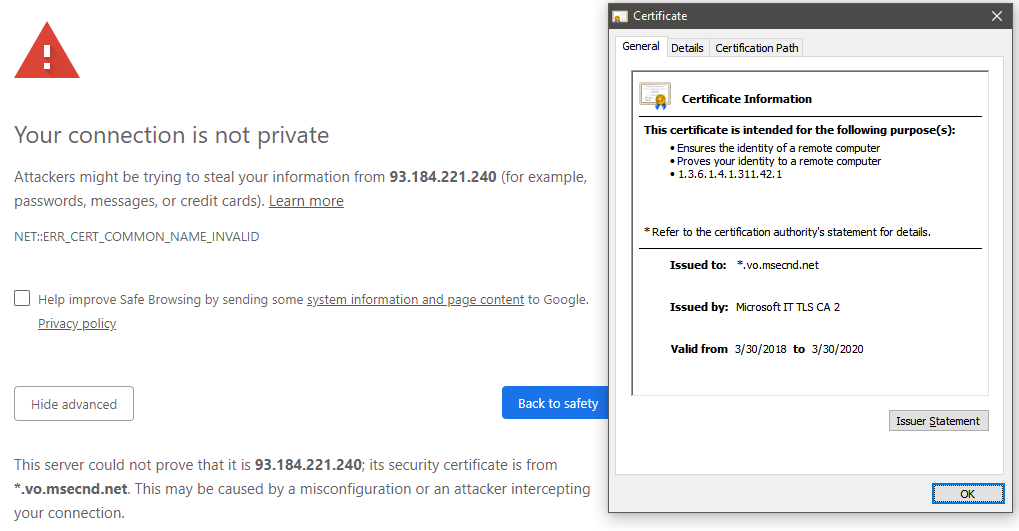
Simply go to your browser address bar and try accessing the IP just like any other website, try both HTTP and HTTPS access, in our case, typing http://93.184.221.240/ returned a 404 Not Found but https://93.184.221.240/ returned something very useful! The original domain hosted at this IP address 🙂
|
|
|
After the certificate error which is normal because we are accessing the website via its IP and not via the domain name, checking the server certificate showed it to be issues by Microsoft for a domain (msecnd.net) |
IP Reputation Check
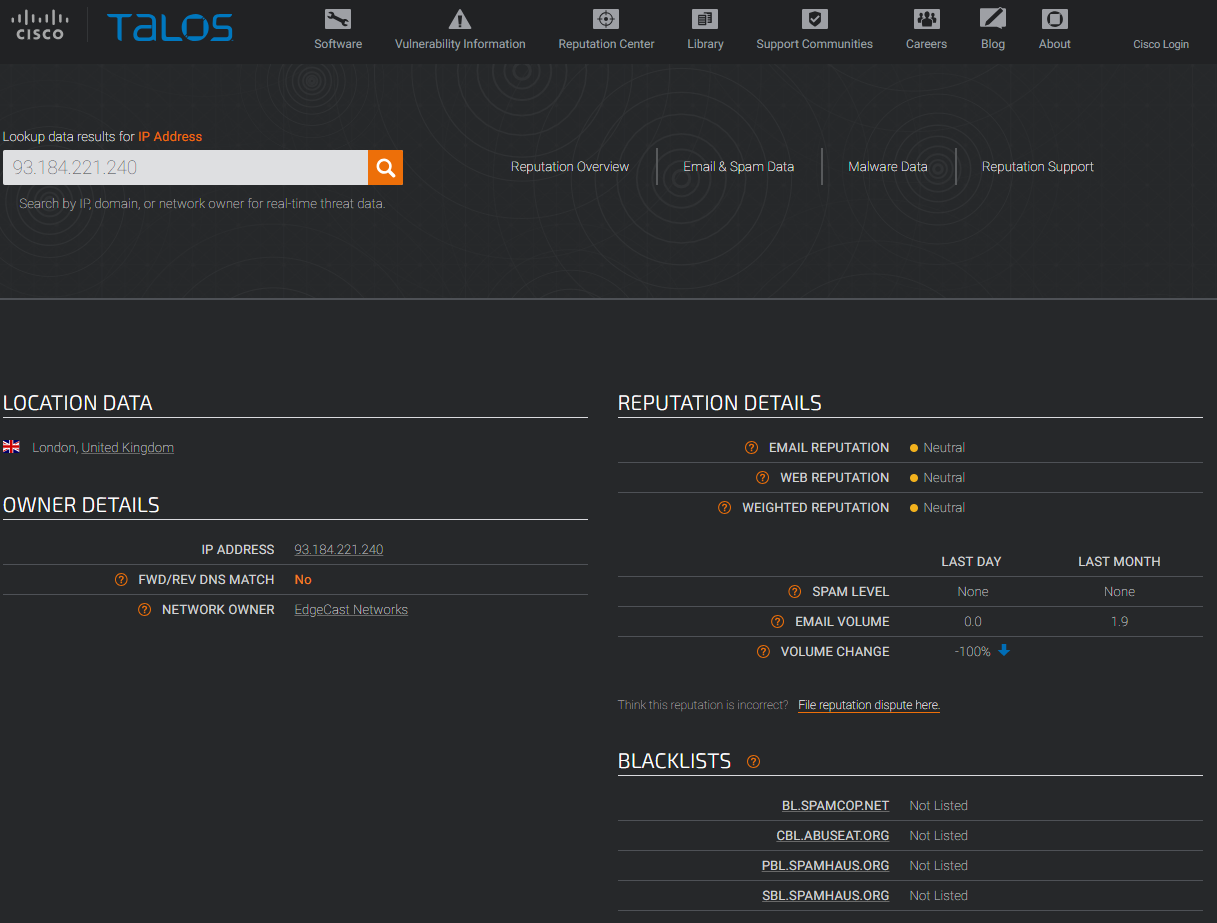
Another check that we can make in case all our previous attempts failed is to check the reputation of the IP address against live IP reputation databases, there are actually a lot of options, just search for “IP reputation check” and a lot of results will come up, here’s a check at Cisco Talos which shows nothing suspicious about this IP.
|
|
|
A check at Cisco Talos shows nothing abnormal about this IP address |
Conclusion
We’ve gone through a lot of actions that can be taken when abnormal traffic usage is observed, the most important thing is to capture artifacts as soon as an abnormality is observed, capture as much data as you can to be able to conclude better results and not be sorry later, packet capture, source & destination IP’s, ports’ usage and process name should be more than enough to shed a light on whatever’s happening in the background, maybe it’s benign traffic like OS updates or undesired traffic like spyware or malware.
Recent Comments