How To Use Fiddler To Troubleshoot HTTP/HTTPS Issues
What Is The Difference Between Fiddler & Wireshark?
So What Is The Difference Between Fiddler & Browser Developer Tools Debugger?
Which Cases Is It Best To Use Fiddler?
Using Fiddler To Intercept Web Traffic
Useful Request And Response Tabs
Decrypting HTTPS using Fiddler
The Proper Way To Share The Captured Fiddler Sessions
A Quick Intro
Fiddler is a very effective tool when it comes to troubleshooting HTTP & HTTPS issues… It’s basically a local proxy that intercepts all HTTP/HTTPS traffic either from all applications or just the application you configure it to…
How Does Fiddler Work?
Fiddler configures itself as a local proxy on port 8888, processes traffic from the client application and then forwards it to the web server so it behaves like any proxy server except that it displays all information in the client application & allows for on the fly HTTPS decryption without the need for server certificate to decrypt traffic.
|
Client Application |
|
Fiddler proxy |
|
Web Server |
|
|
|
|
|
|
Or in case there is a proxy device
|
Client Application |
|
Fiddler proxy |
|
Explicit Proxy |
|
Web Server |
|
|
|
|
|
|
|
|
What Is The Difference Between Fiddler & Wireshark?
Simply put, Wireshark is a network debugging tool while Fiddler is a dedicated HTTP/HTTPS debugger.… While both tools can be used to troubleshoot web traffic issues, Fiddler excels in some areas, for example:
-We can use Wireshark to capture the traffic but it will not decrypt HTTPS without the correct keys.
-Fiddler can decrypt HTTPS traffic if you trust its root certificate…
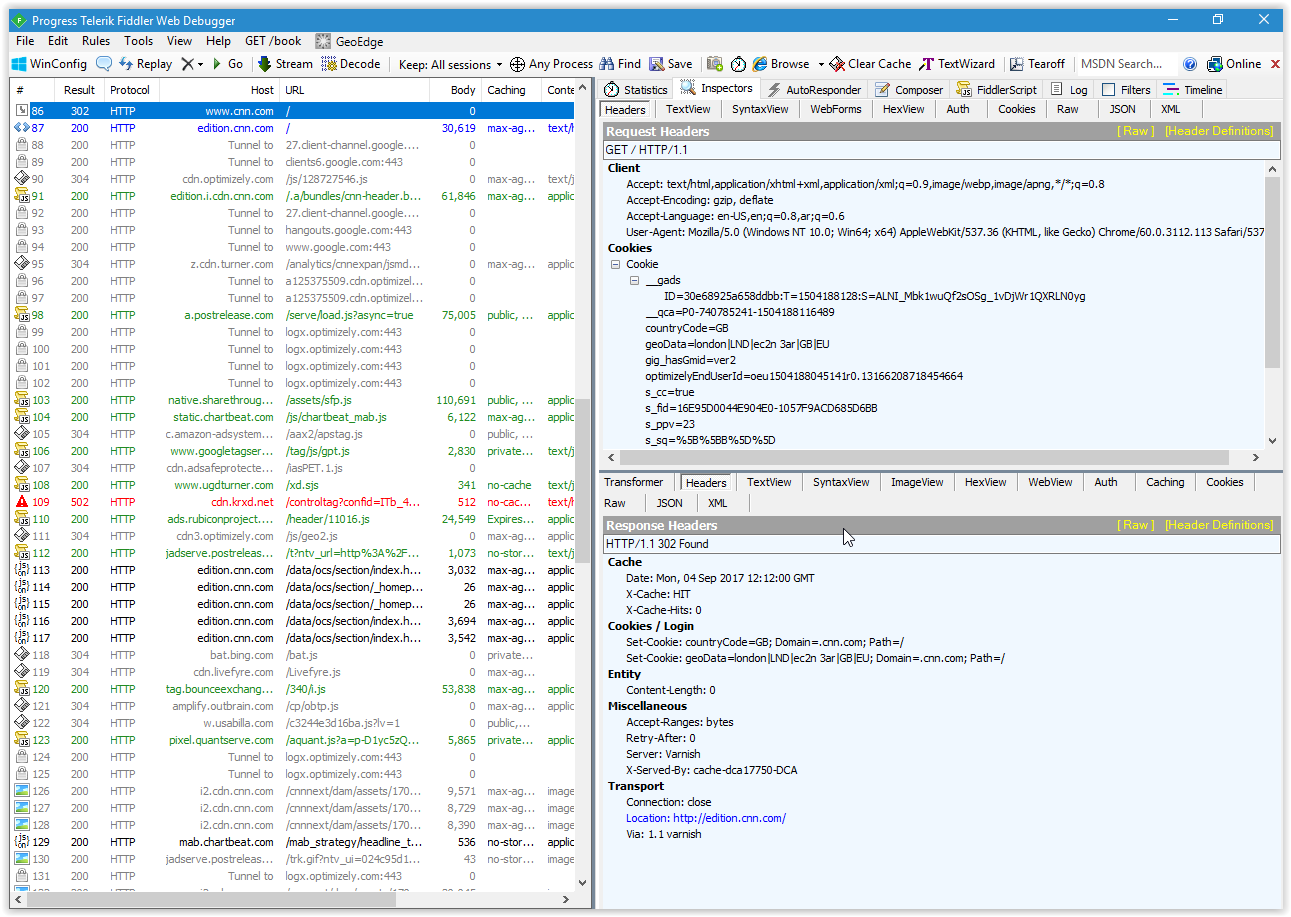
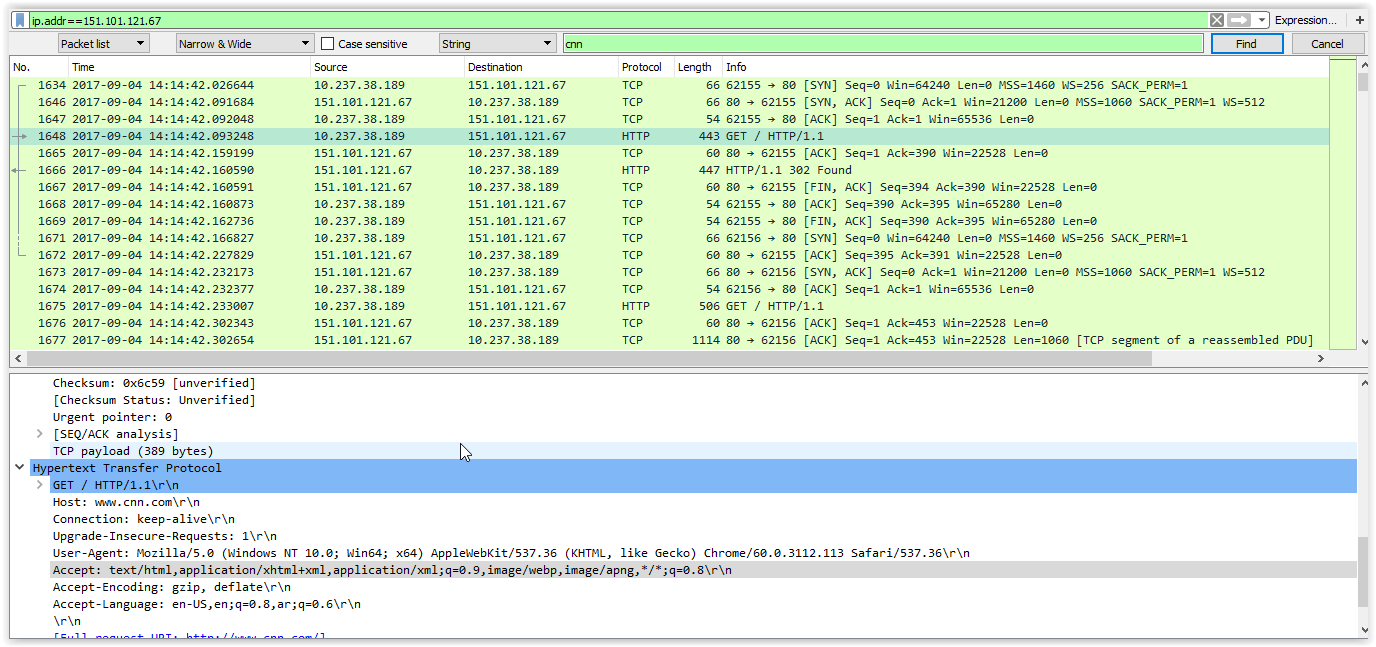
-Fiddler is made specifically for debugging web traffic, it will clearly show every HTTP request and its response while generously displaying all sorts of information organized in a way that can be navigated easily… Refer to the below session captured both by Fiddler & Wireshark… We can see clearly the difference in the way the information is displayed although technically it’s the same web session!
|
|
|
Session capture using fiddler shows every HTTP request and its response |
|
|
|
Wireshark packet capture shows the same session on packet basis, we need to “Follow” each TCP session in order to take a closer look and inspect it. |
In addition to what’s previously explained, Fiddler makes it way easier to debug HTTP issues specially when the problem is when a web page loads but there is a problem on a certain element on the page, since we can see each HTTP request for each on-page element separately…
So What Is The Difference Between Fiddler & Browser Developer Tools Debugger?
Both Fiddler and built-in browser developers tools like Chrome Developer Tools can show the same results since they both work on the application level (by application here we can say layer 7, browser or the web application itself)… However:
-Fiddler displays the information in a more organized way.
-In case advanced debugging is needed! Fiddler can be scripted to modify web requests/responses on the fly.
It boils down to this: Whatever you choose remains a matter of personal preference and the nature of the issue that is being tackled.
It’s also worth to note that Fiddler can import HTTP sessions from a number of formats including HTTP Archives from browser developer tools & Wireshark captures from the File > Import Sessions menu!
|
|
|
File > Import Sessions to import from a number of formats including of course Wireshark packet captures! |
Which Cases Is It Best To Use Fiddler?
As mentioned before, Fiddler can be used to debug all web traffic from any application on the machine, but Fiddler’s powerful debugging engine particularly shines through when:
-HTTPS traffic debugging is needed.
-There is an issue with a specific element on the page.
The latter point is highlighted when the web page with the issue requests data from multiple domains (which is the case with almost all web pages anyways) and we are not sure which HTTP request is causing the issue… In Fiddler’s session list we can see all requests and it’s very clear which ones do not return an expected response code.
Maybe a certain element on the web page is loaded from a URL that is not allowed on the proxy? Fiddler will show exactly that in a less messy way than Blue Coat’s Policy Trace.
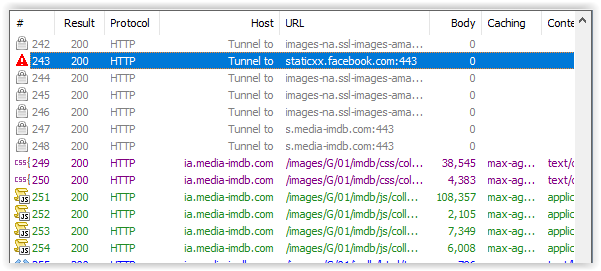
Take for example the sessions below from a request to load the page at www.imdb.com where the page loaded normally except for some elements like a referral to a domain staticxx.facebook.com which was blocked by the proxy:
|
|
|
|
|
Fiddler shows exactly which HTTP requests had issues |
How To Install Fiddler?
Now that it’s clear how useful Fiddler can be, it can be downloaded from https://www.telerik.com/download/fiddler
Also it’s worth to note that Fiddler can also be run as a portable without the need for installation in case the user does not have admin rights on his machine or he simply does not want to install additional software… The downloaded executable can simply be extracted with 7zip and the application will run normally.
Using Fiddler To Intercept Web Traffic
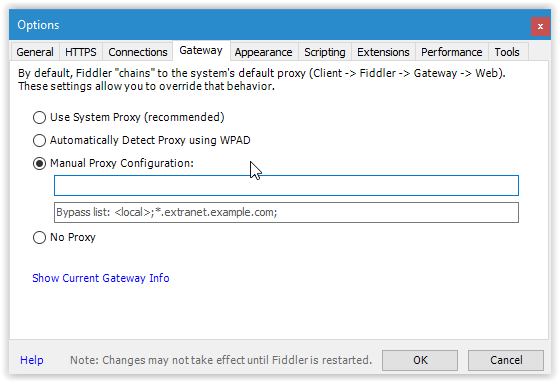
When you run Fiddler, it will automatically set itself up as a proxy on local port 8888 and modify the browser settings to direct all web traffic to itself… In the case when we are already using an explicit proxy, it will overwrite the settings in the browser… Therefore in order to simulate the same traffic between client and the previously configured explicit proxy, we need to tell Fiddler to use this proxy… This is called “Proxy Chaining” (proxy after a proxy in a chain) and can be configured from Fiddler settings under Tools > Options as shown here
|
|
|
Here we tell Fiddler to use a proxy to simulate the original traffic path |
|
In case we cannot see any captured sessions in the session list, make sure traffic capture is turned on from “File > Capture Traffic”, if it’s checked but there is still no sessions then try to run Fiddler as administrator |
|
Sometimes when using Chrome & debugging some HTTPS sites like Google sites and Amazon, we will still get a security warning even if the Fiddler root certificate is trusted, this is due to extra checks done by the browser… In this case we need to use internet explorer for those websites only. |
|
|
|
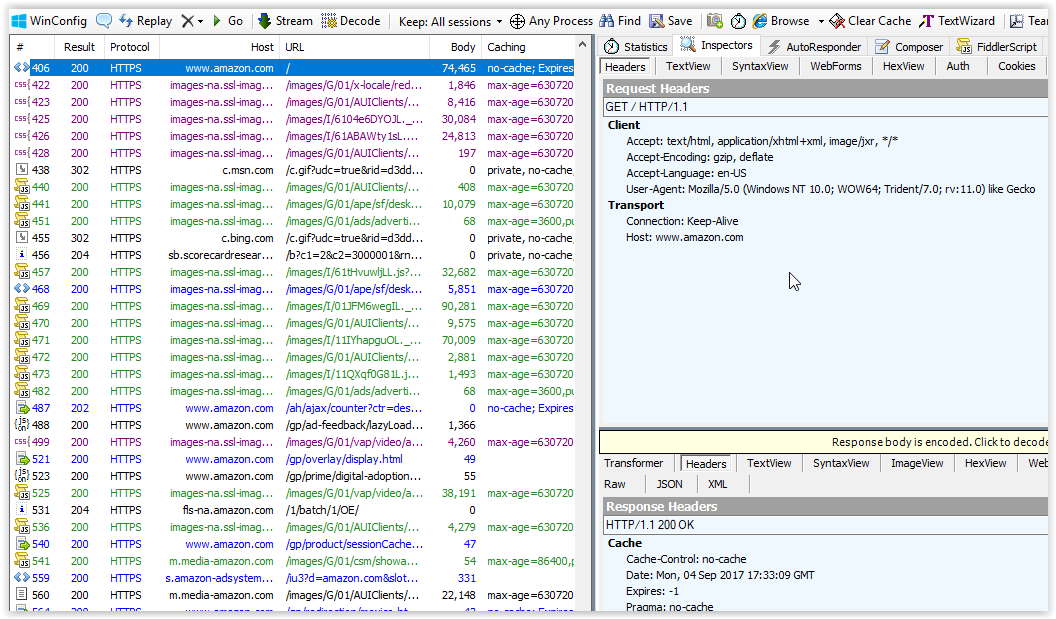
In the left pane we can see all the sessions captured, in the top and bottom right panes we can see the request and response data |
Useful Request And Response Tabs
Once Fiddler is running and capturing traffic, you should see all captured sessions in the left pane, click any session in the left pane to see:
-The HTTP request in the upper right pane.
-The HTTP response in the lower left pane.
For each request and response, there are eight different tabs, of particular interest to us is the “Inspectors” tab, under the inspectors tab we have access to 10 sub tabs… Of use to us will be:
Headers
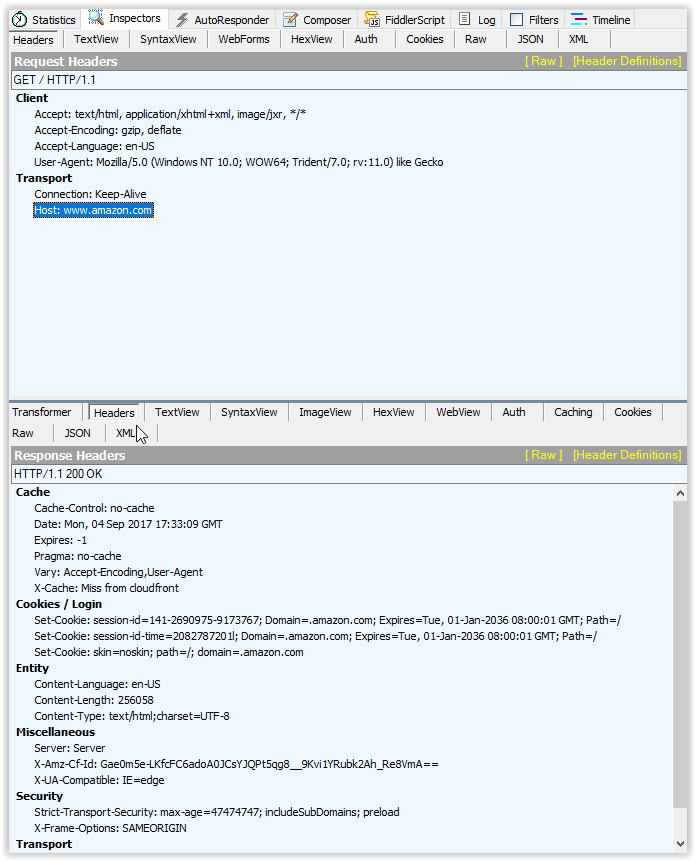
Shows the HTTP headers with all the header info that has been sent, including cookies.
|
|
|
Lots of useful information can be accessed using the Headers tab |
Textview
Shows the request/response data in plaintext if it’s possible, doesn’t make sense if it’s an image… If the request/response is not plaintext then you may be prompted to click on “decode the response” in order to be able to read it.
Auth
Shows any authentication headers, useful for proxy authentication debugging.
Decrypting HTTPS using Fiddler
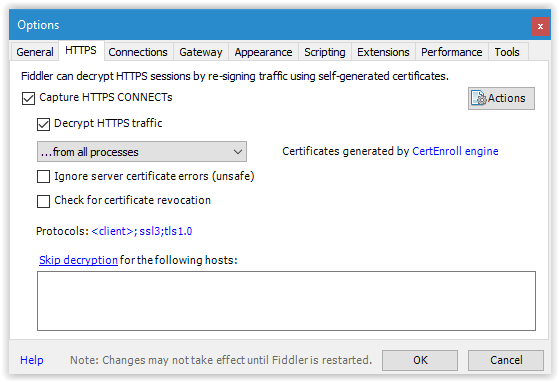
By default, Fiddler does not decrypt HTTPS traffic unless you tell it to, go to the Tools > Options and then obviously the HTTPS tab, make sure to check both “Capture HTTPS CONNECTs” & “Decrypt HTTPS traffic”… You will also be prompted to trust Fiddler’s root certificate which is not mandatory but it is preferred in order to avoid annoying browser warnings due to invalid certificate…
|
|
|
Allow Fiddler to capture and decrypt HTTPS to be able to troubleshoot encrypted requests |
|
In case of HTTPS decryption, it is very important to notify customer that any credentials he will enter will be visible in the Fiddler debug output! In case he needs to send us the session then those need to be obfuscated first! |
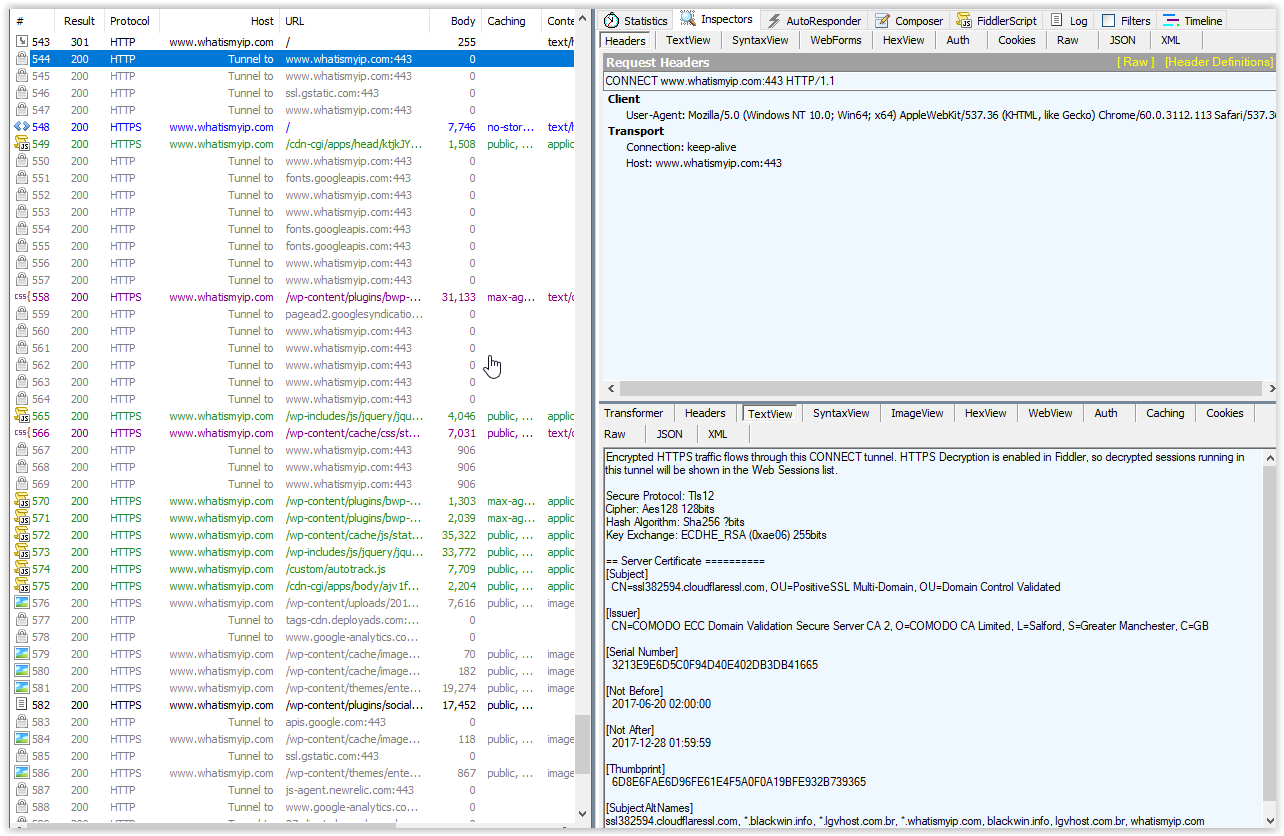
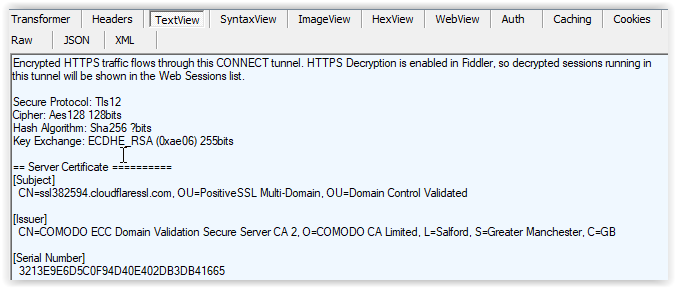
After HTTPS decryption has been enabled, all HTTPS tunnels going through Fiddler will be decrypted as it’s shown here
|
|
|
|
|
HTTPS traffic going through this tunnel is now decrypted |
The Proper Way To Share The Captured Fiddler Sessions
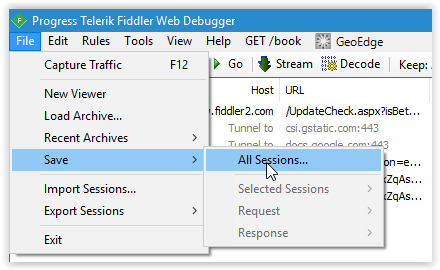
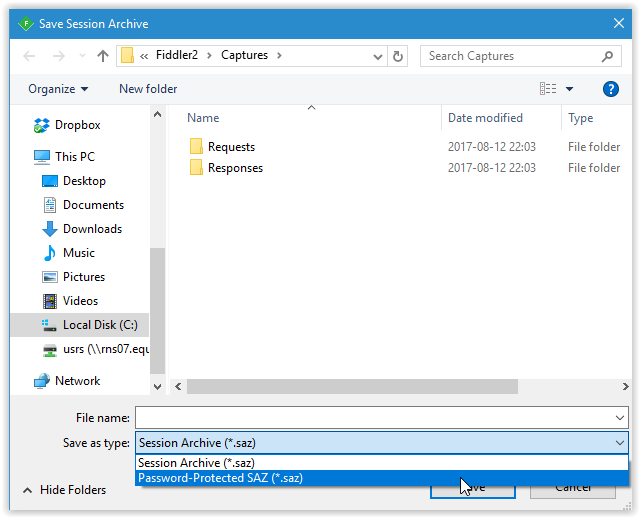
After a debugging session, we may need to share the captured sessions for any reason, in that case the sessions can be saved into a file by going to the File > Save > All sessions… You will also we warned that the captured sessions may contain sensitive information like passwords which was the point mentioned earlier… So make sure to notify customer about this… Another point is that it is always better to save the sessions as a password protected file in case any credentials are entered.
|
|
|
Captured sessions can be easily saved to a single file from the “File” menu |
|
|
|
Saving the sessions in a password protected file is better in case there’s sensitive information in the captured sessions like credentials or private data entered on a web form |
Conclusion
Fiddler is a free & great tool that is built for debugging web applications, it basically does the same functionality like the built in browser debugging tools but offers more advanced ways to view and modify the traffic on the fly, go ahead and experiment with it and you’ll never look at the browser network debugging tools again!








Recent Comments